Techlog Field Map
Visualize your well data in a 2D map viewer—any curve in Techlog wellbore software can be summarized on a zone by zone basis for mapping and quickly displayed in the 2D map viewer.
Visualize your well data in a 2D map viewer—any curve in Techlog wellbore software can be summarized on a zone by zone basis for mapping and quickly displayed in the 2D map viewer.


The Field Map module enables users to perform the following:
- Display the desired set of wells in a 2D map viewer via drag-and-drop from the Project Browser; well symbols (oil producer, gas injector, etc.) are retrieved from the project data store as a well property.
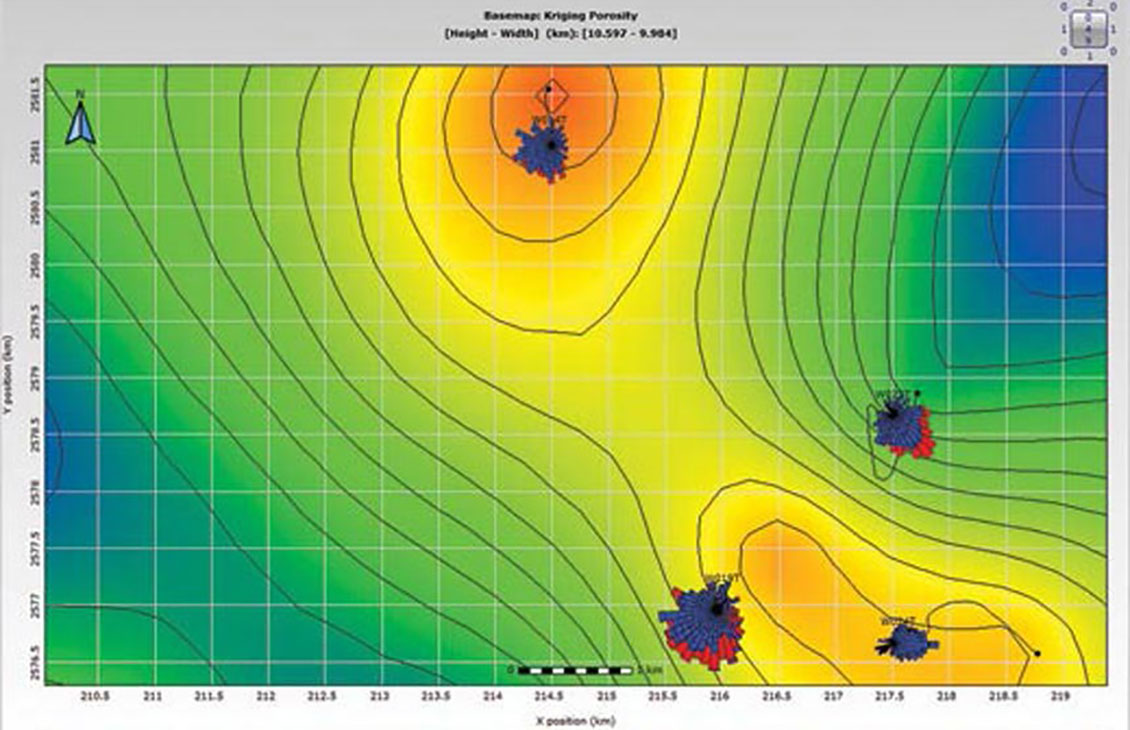
- Compute any chosen value or parameter from the well logs, cores, or results as a surface, using kriging as the contouring algorithm; interactive adjusting of the variogram parameters to investigate data uncertainty across the field or project can also be performed.
- Directly retrieve the data to be mapped from the results of the summaries computation (e.g., average petrophysical property by zone or fluid zone).
- Place the mapped values at the actual X, Y locations of the zone represented by the map, based on well deviation and depth-to-surface; well trajectories may also be projected onto any map.
- Create 2D displays of the wells with an overlay of an average porosity map
- Use a Variogram plot to set the kriging parameters within the Field Map module.
- Can create a complex 3D map created within the 3D Vue module.
- Connect field development modeling to economic engines through the Petrel platform.

Graphics capabilities
The Field Map module allows any image to be applied as a background. Well positions can also be represented by a symbol or a plot image (such as Stereonet).
2D map outputs
Finished maps can be easily saved and then instantly retrieved, printed, or displayed within the 3D Vue module.
2D well trajectory
The Field Map module features a trajectory plot tool. This provides a 2D representation of your well trajectory, plotted with logs and zones.

NExT Techlog training courses
NExT offers a comprehensive training program to support users of the SLB software, plugins, and other software products.
In this section
-

Techlog Advanced Plotting
Use well path trajectories to locate wellbores within their spatial positions, to create a 3D model of the reservoir or geological structure under studyUse well path trajectories to locate wellbores within their spatial positions.
-
Techlog Field Map
Any curve in Techlog wellbore software can be summarized on a zone by zone basis for mapping and quickly displayed in the 2D map viewerVisualize your well data in a 2D map viewer.
-
Techlog Ipsom
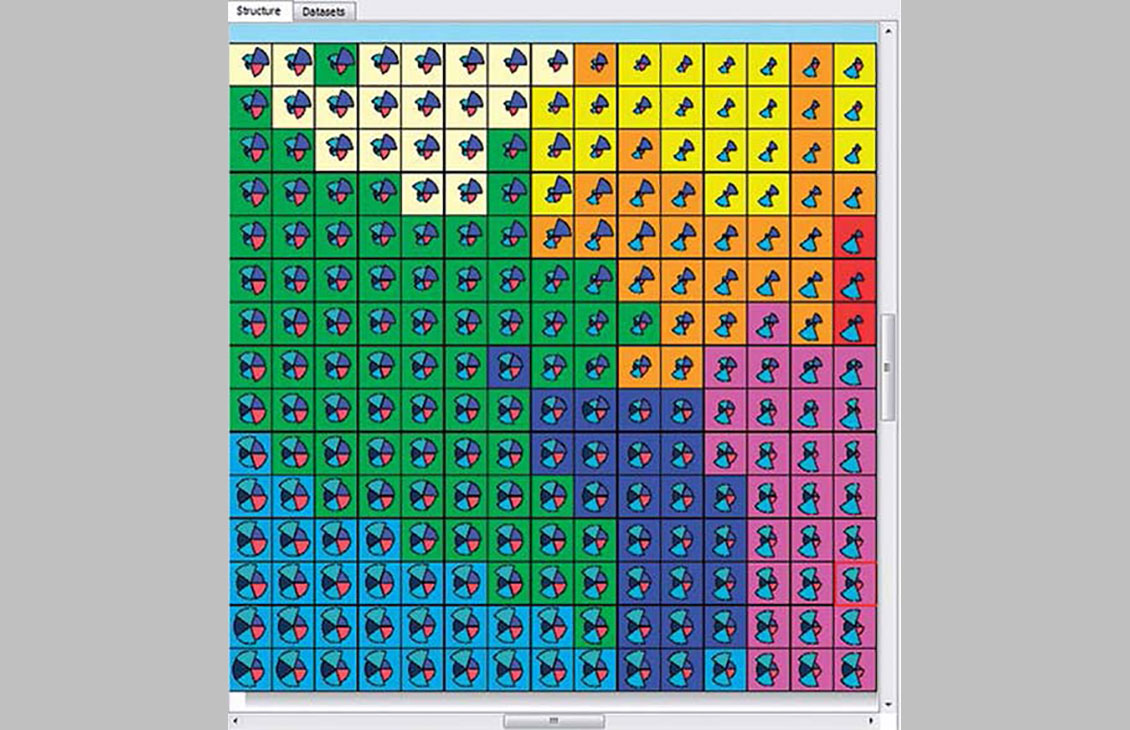
Use the 2D indexed and probabilized self-organizing map to help your geological interpretation of log data and facies predictionPredict and propagate rock classification groups.
-
Techlog K.mod
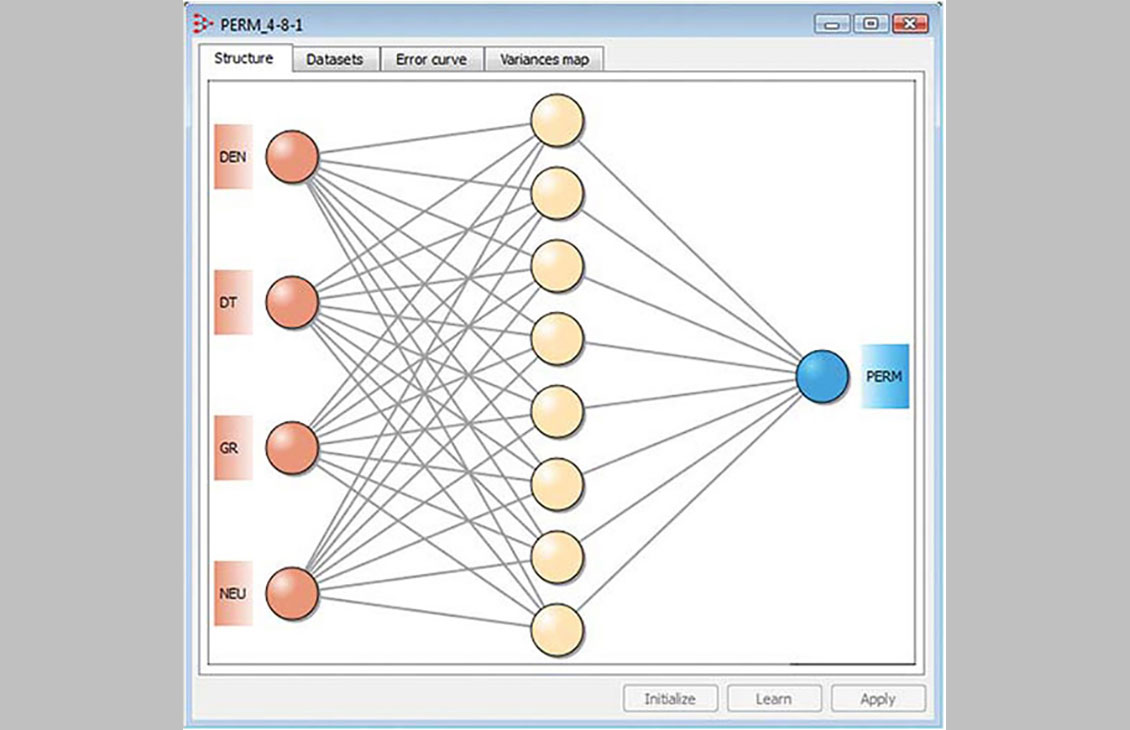
Use log data and the powerful neural network capabilities to predict non-recorded parametersObjectively reconstruct your missing data.
-
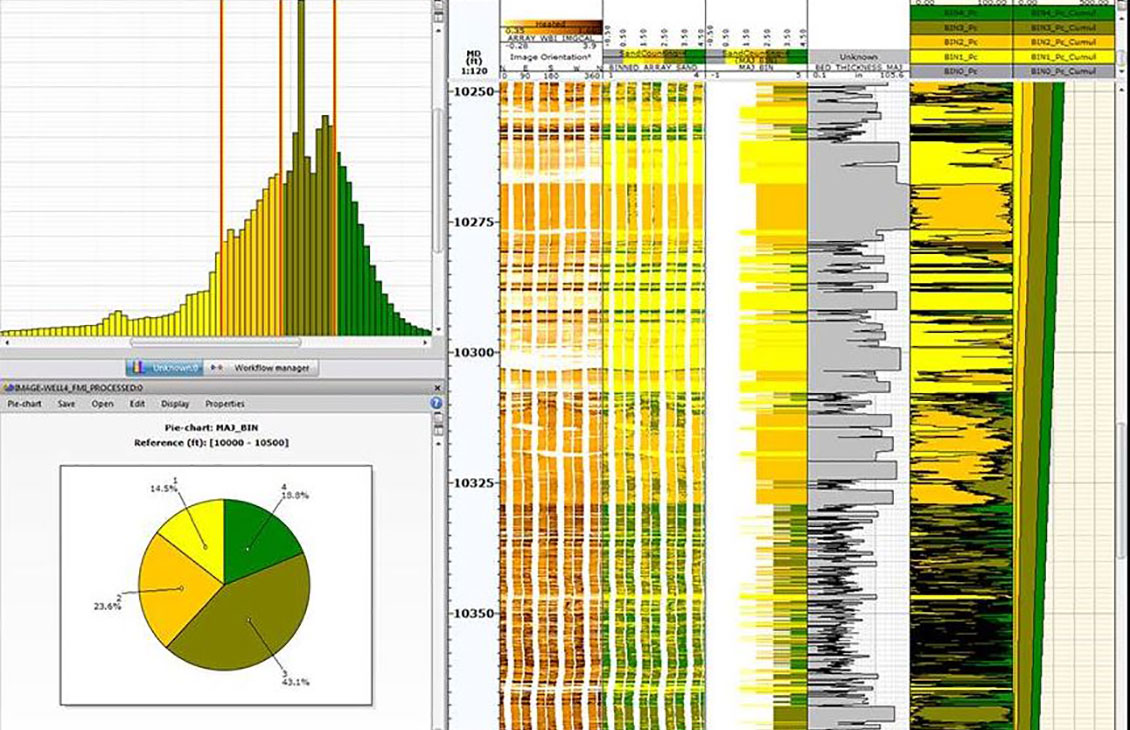
Techlog Wellbore Imaging
Sophisticated image analysis, automatic tool and vendor recognition for raw and processed data, and simplified loading and analysisSophisticated image analysis, automatic tool and vendor recognition for raw and processed data, and simplified loading and analysis.