Techlog Quanti.Elan
Multicomponent inversion model incorporating the ELAN solver
Benefit from tried-and-tested algorithms within a modern and intuitive interface.
Advanced classification
The Ipsom module's capability to predict and propagate classification groups helps to improve interpretation workflows. Its 2D indexed and probabilized self-organizing map (SOMap) is designed for use in:
Comprehensive statistical tools
Results are quantified and refined through an iterative process during the final control and validation phase. The statistical and graphic tools are easy to use and lead to a better understanding of coherence between core description, log responses, and consistency on the map. This allows for the:
Accurate model calibration
Calibration is key to the classification process. Its aim is to give each neural unit an actual geological meaning; a process known as the indexation phase. Each neural unit is then assigned a code that corresponds to a geological interpretation (detailed core description). This stage is essential for direct interpretation of electrofacies in sedimentological terms.

Outputs

NExT offers a comprehensive training program to support users of the SLB software, plugins, and other software products.

Use well path trajectories to locate wellbores within their spatial positions.
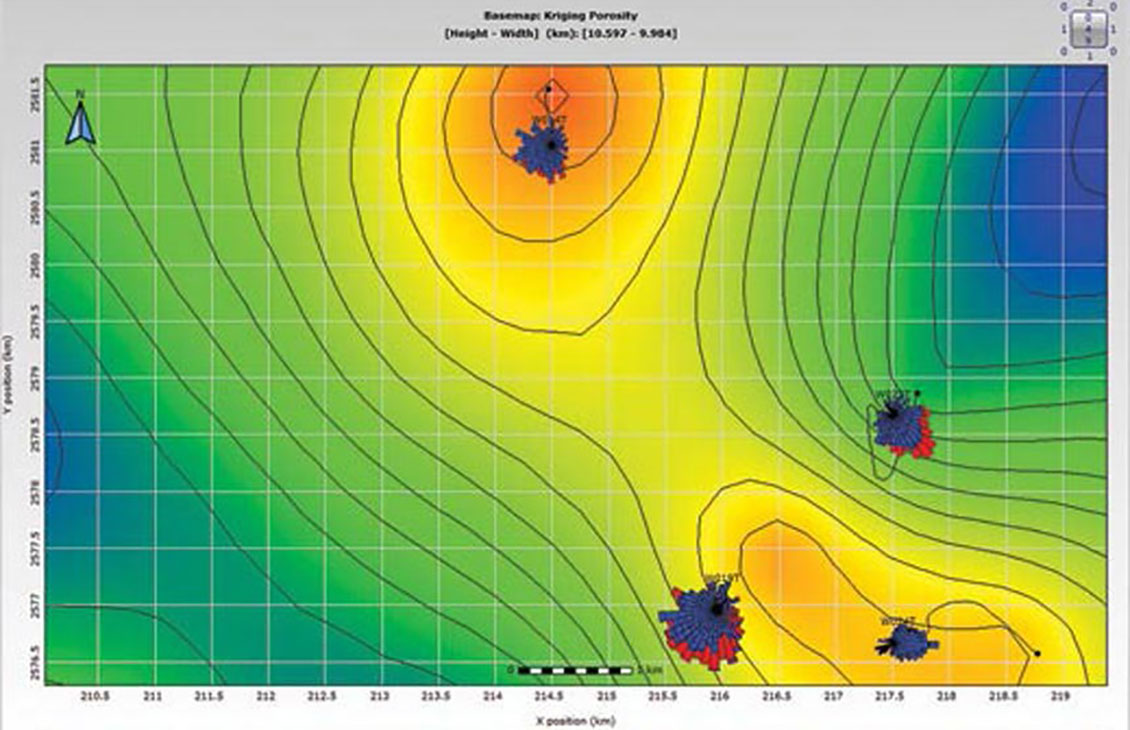
Visualize your well data in a 2D map viewer.
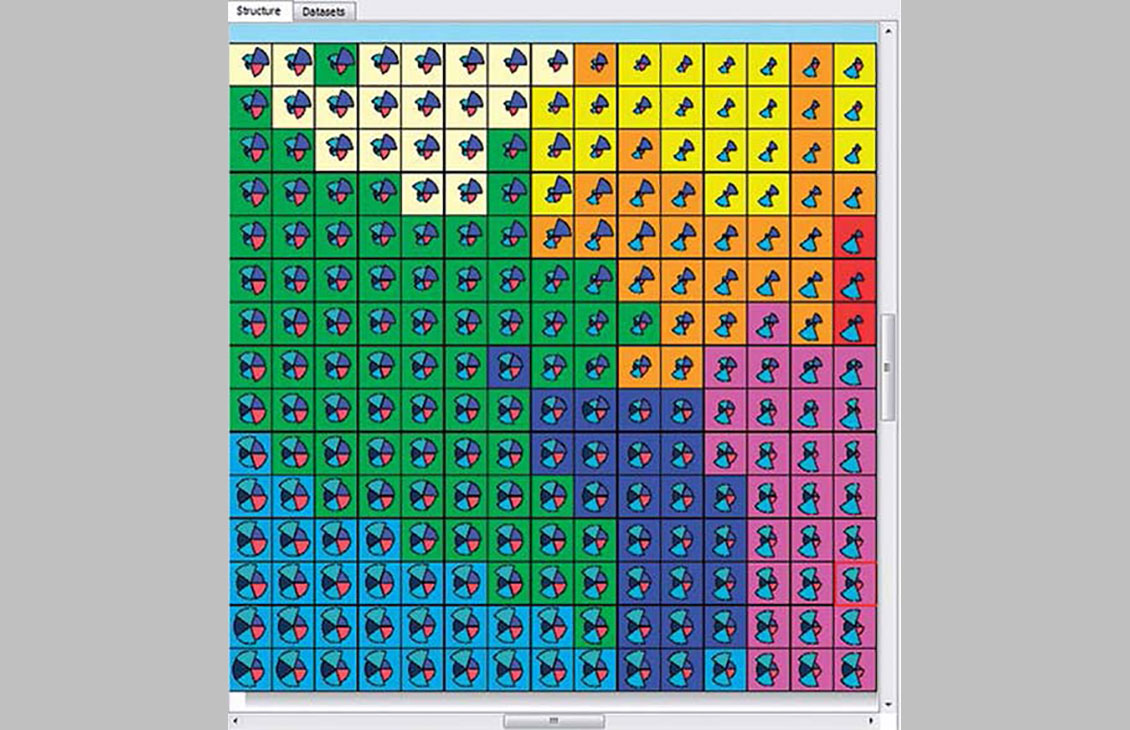
Predict and propagate rock classification groups.
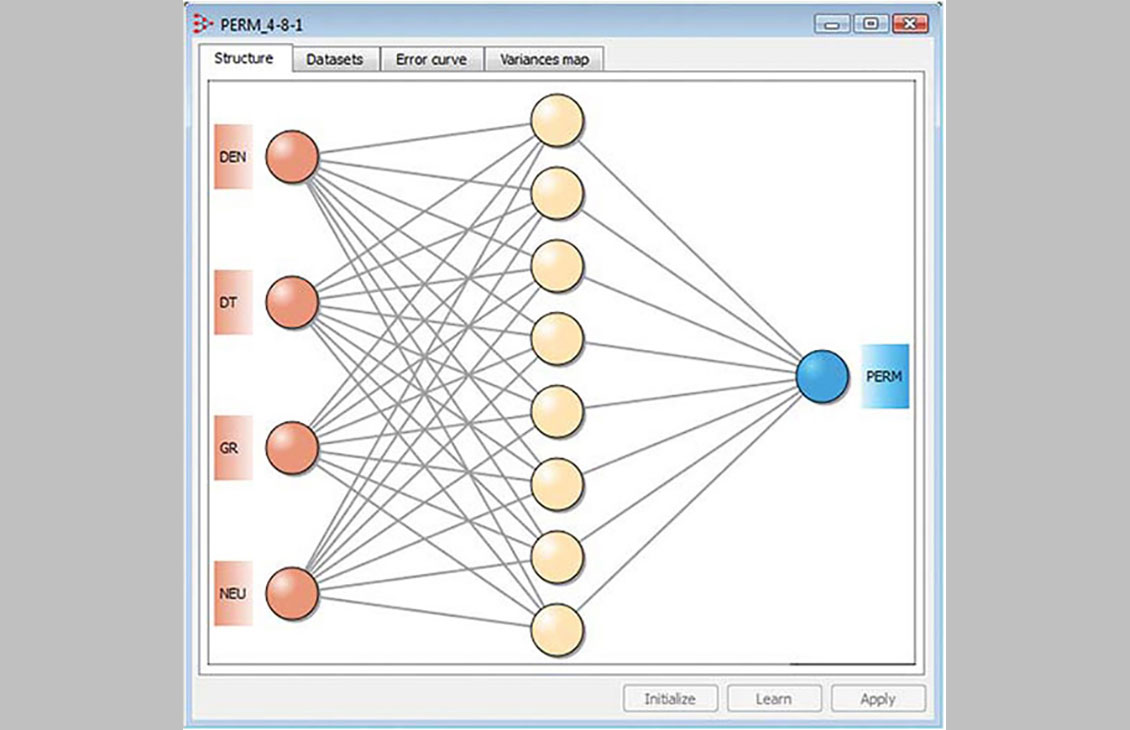
Objectively reconstruct your missing data.
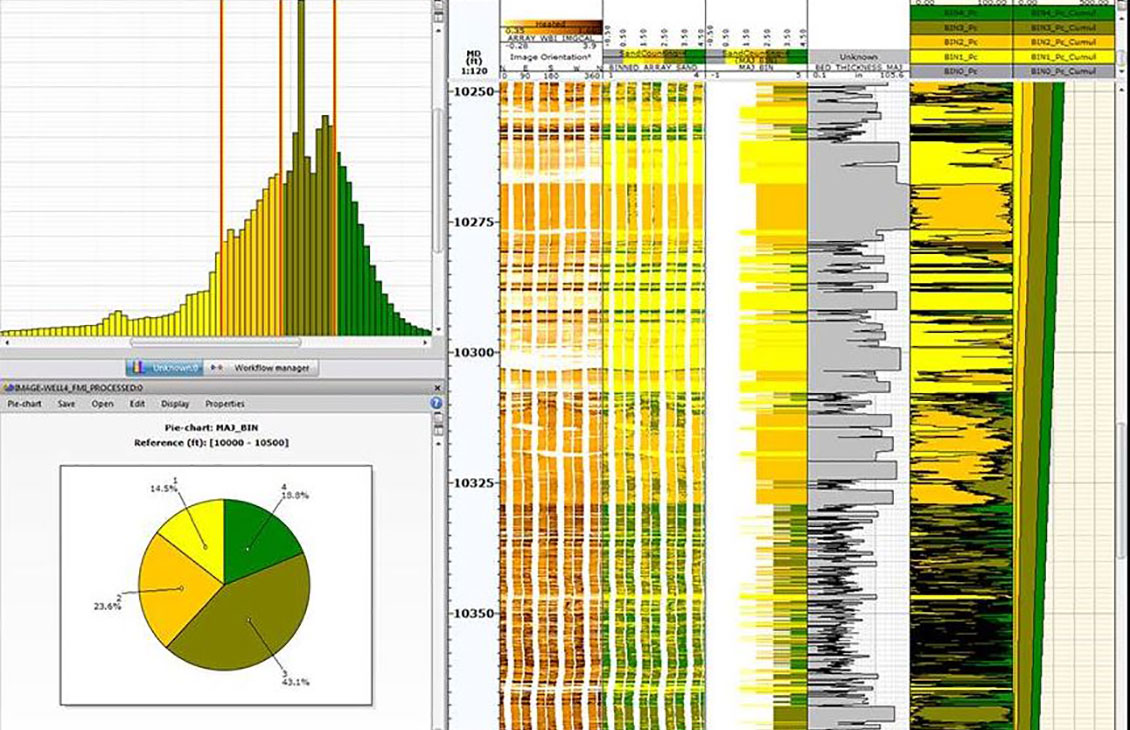
Sophisticated image analysis, automatic tool and vendor recognition for raw and processed data, and simplified loading and analysis.