Petrel Combined Core
The power and capabilities required for full exploration and production studies
Petrel™ data analysis enables interactive analysis of distributions and trends and their relationships across all data types. Histogram, function, and stereonet windows—as well as the Petrel data analysis process—are provided for analyzing upscaled well data and grid properties.
The interactive variogram analysis includes options for initial search-cone parameter suggestions and fitting the variogram to the regression curve, with the ability to also build nested variograms. Detailed analysis can be saved for each property for direct use in the modeling processes. Sensitivity plots enable users to compare the impact of each uncertain variable in a risk-analysis context.


NExT training courses address the unique needs of each learner. Our courses, led by distinguished experts in their fields, equip learners with the skills to address practical situations and resolve real-world challenges.
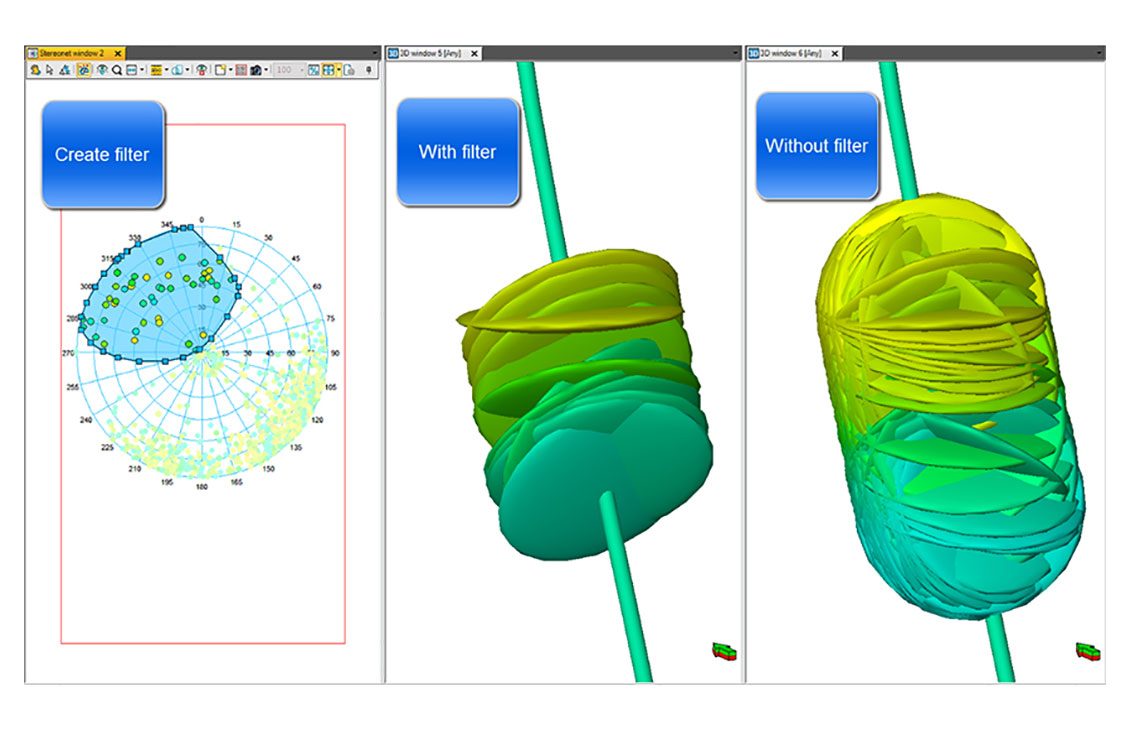
Analyze any data from all angles
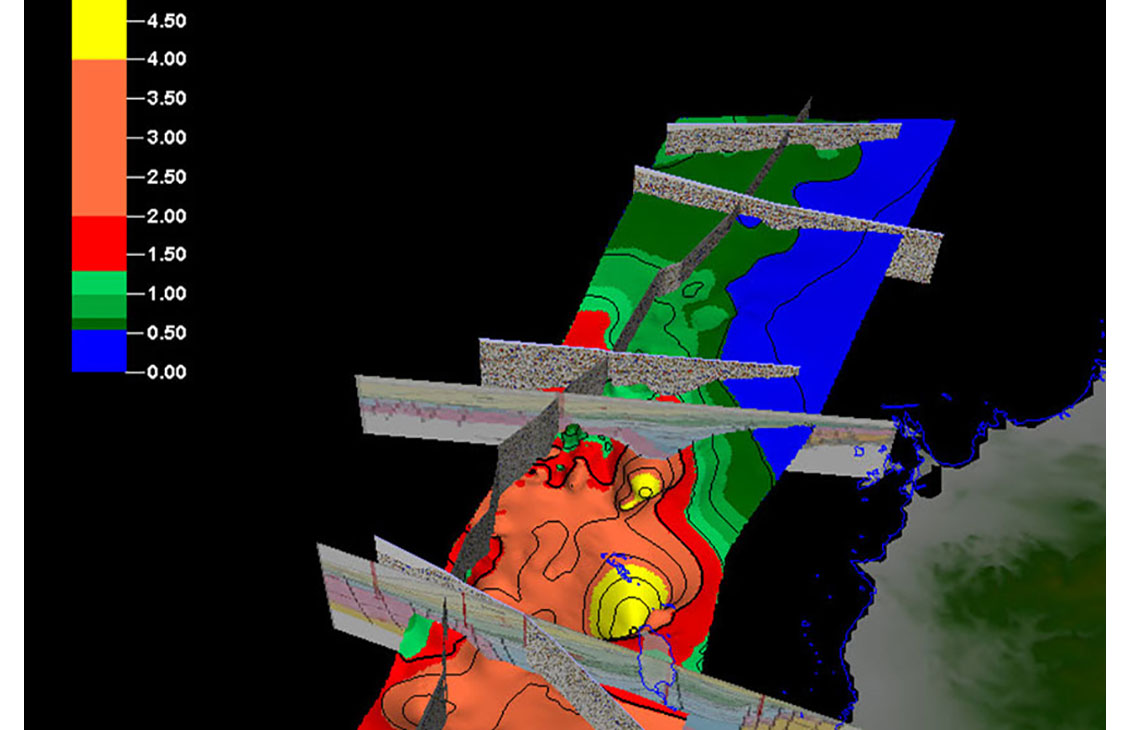
Analyze petroleum systems from basin to prospect scale.
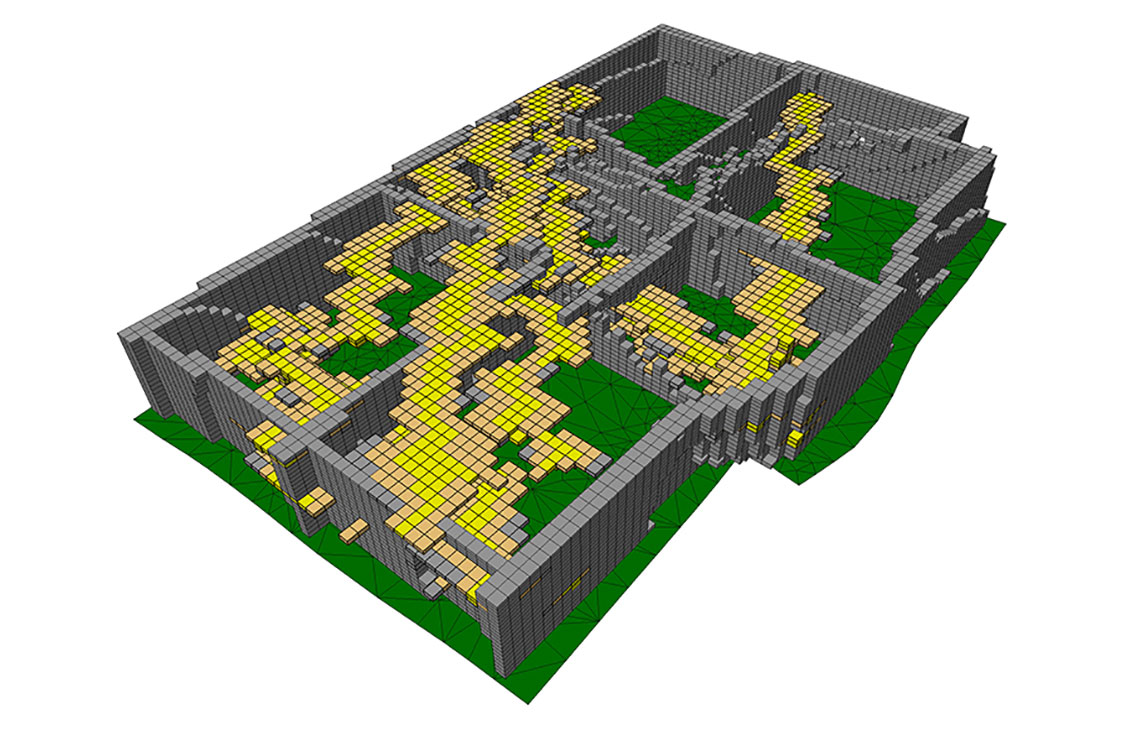
Build accurate facies models
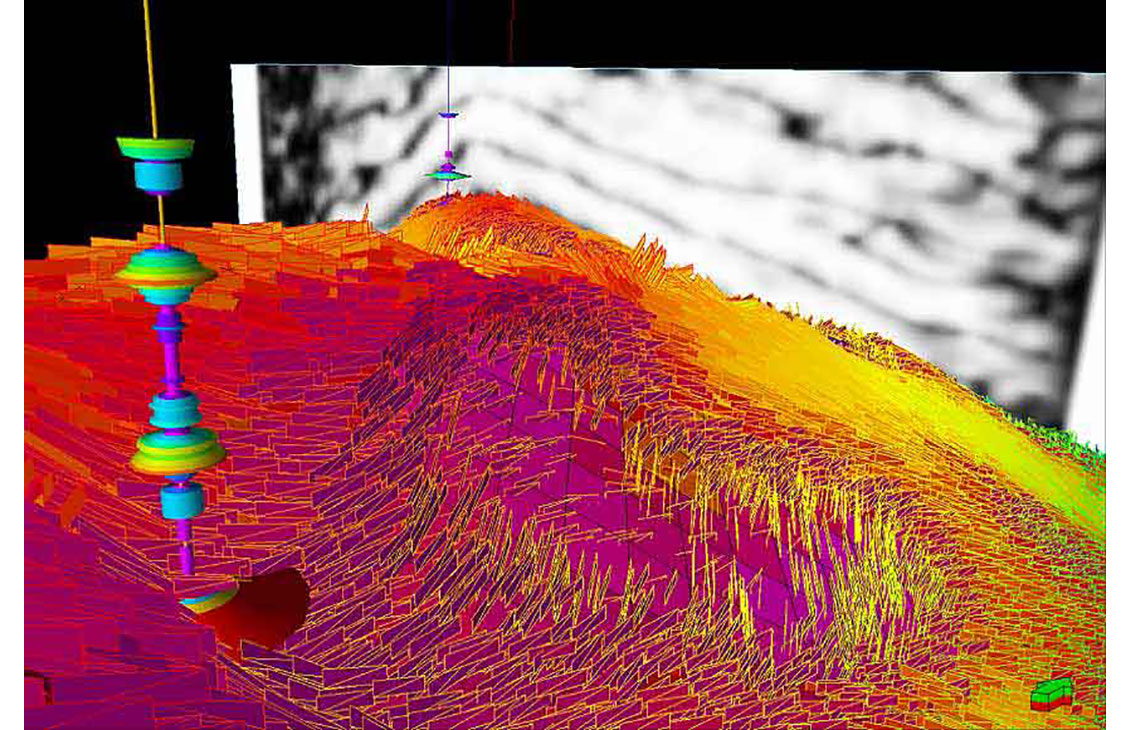
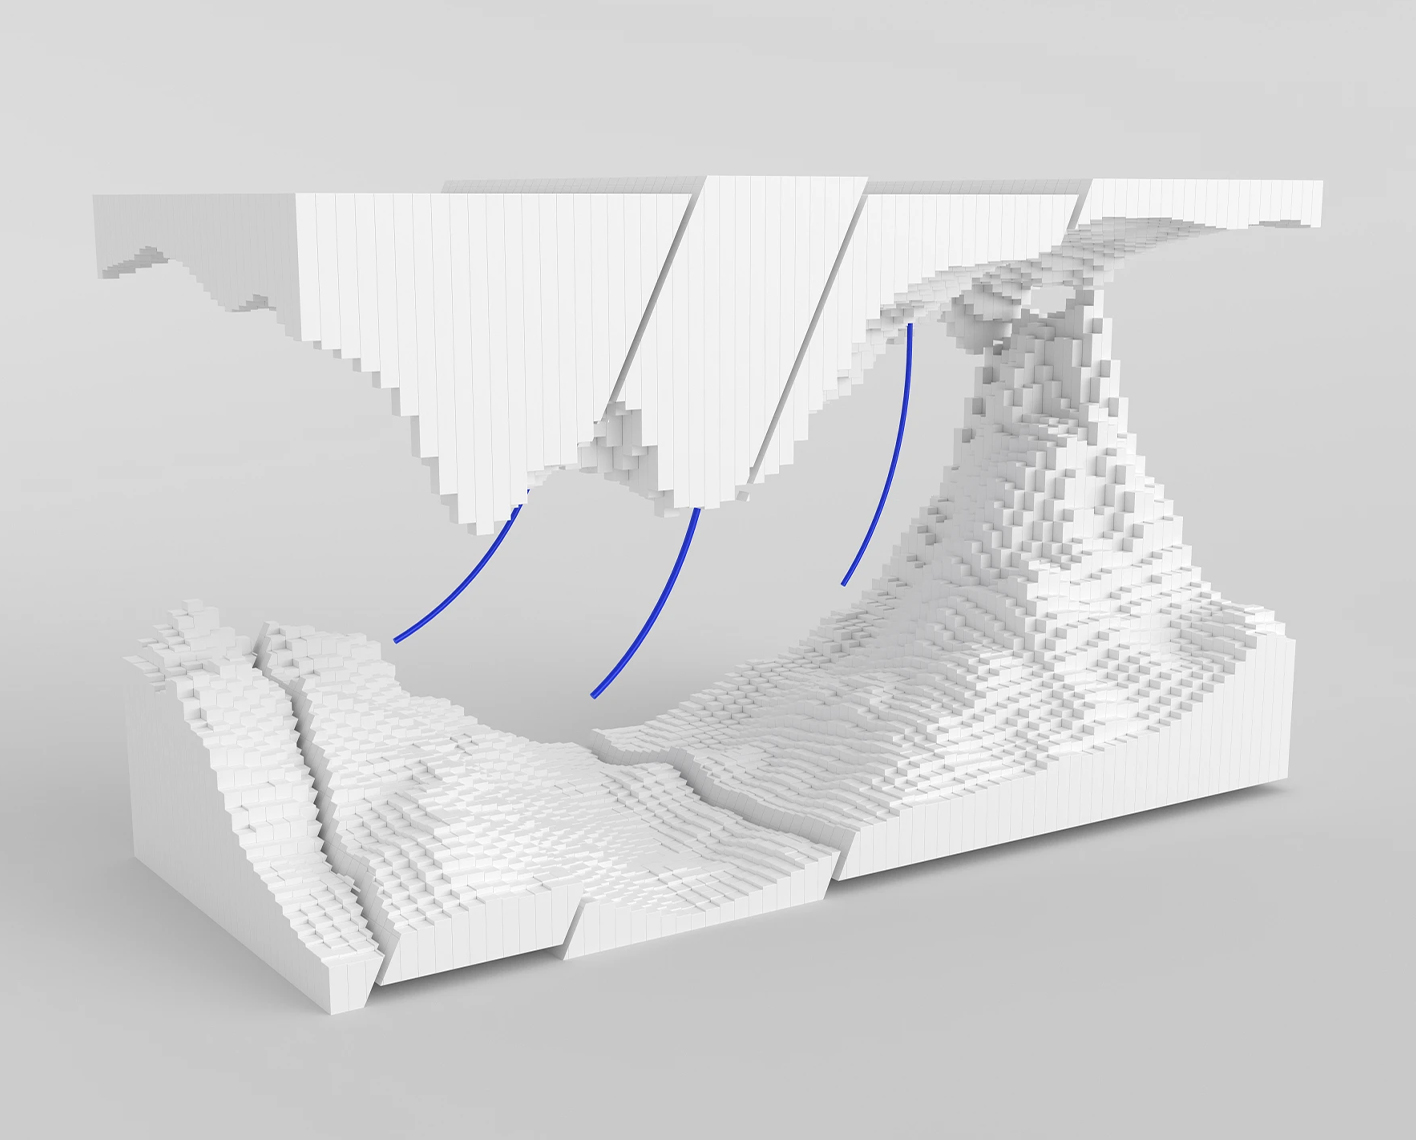
Create geologically consistent fracture models
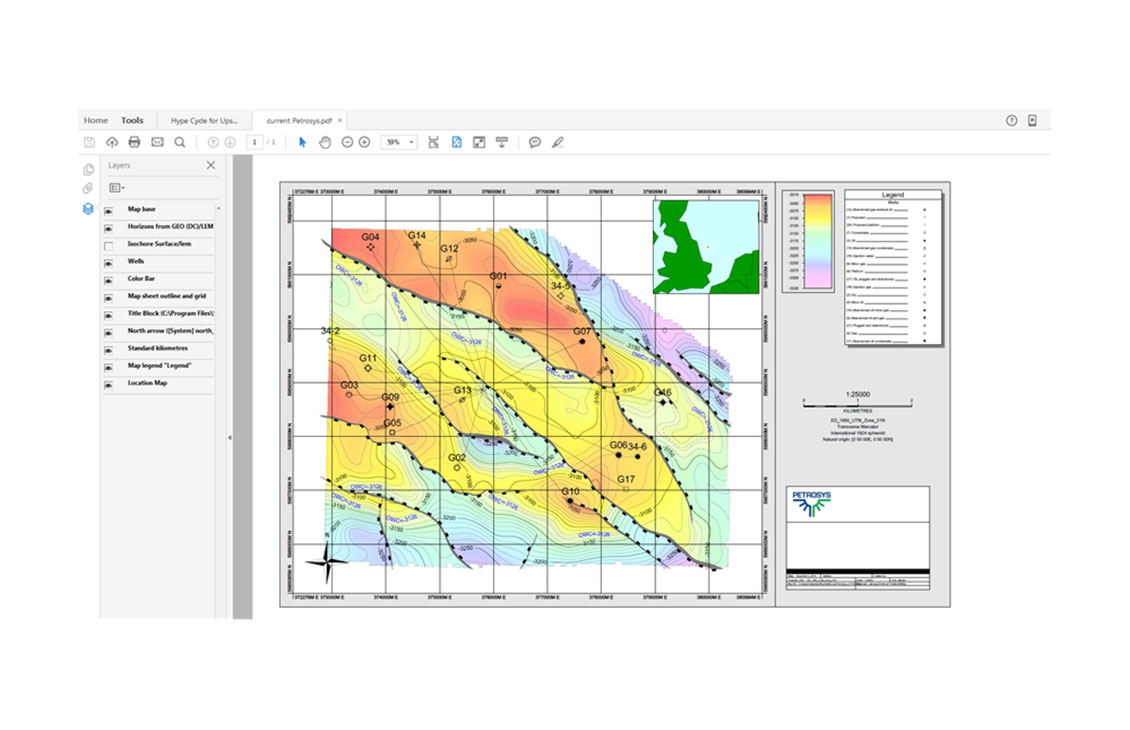
Advanced presentation quality mapping.
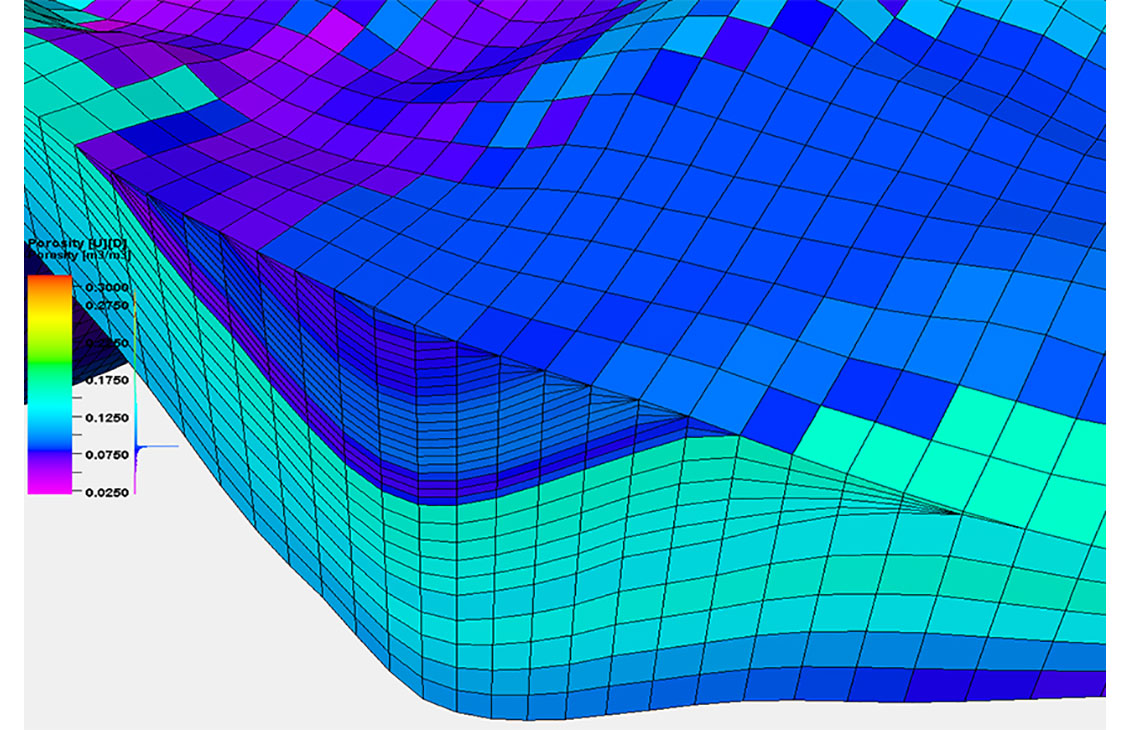
Build accurate petrophysical models

Achieving production objectives with full stochastic evaluation of exploration portfolios
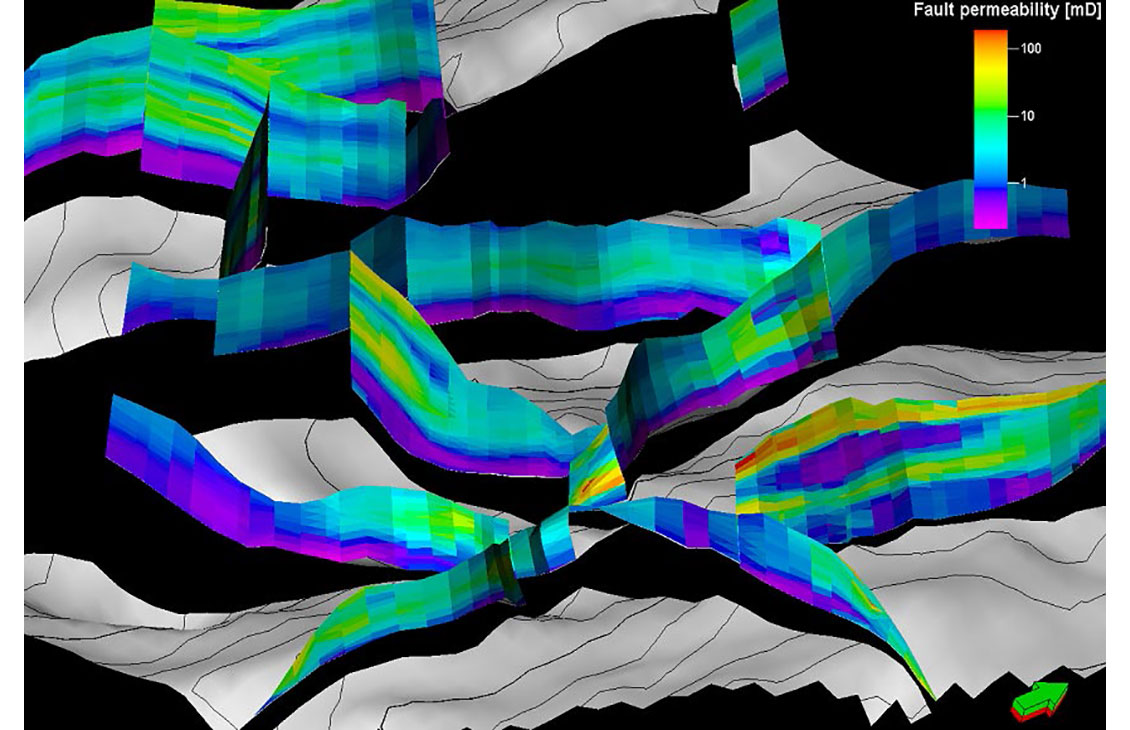
Analysis of fault sealing capabilities and mapping QC tools
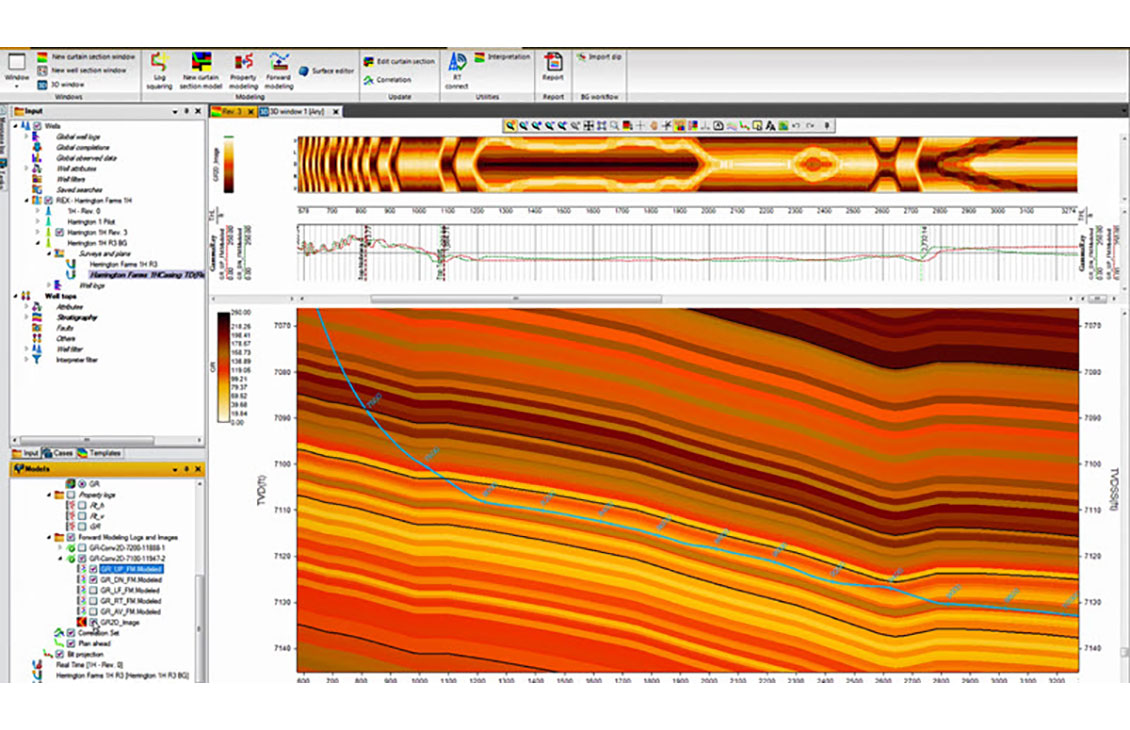
Display, organize, and interpret any type of well data in a flexible 2D environment